Tool for Rapid Analysis of Care Services (TRACS)
The real challenge was getting the data
The councils in England were using many different solutions to manage care services: major systems include CareFirst, Swift, Framework-I, Paris, and Raise and there were all manner of smaller systems used in addition. Not only did configuration vary across organisations - it varied across services!. The TRACS team built logic to translate these variations into a single dataset suitable for analysis (TRIPS significantly improved on this ability).
The solution was "packaged" and rolled out
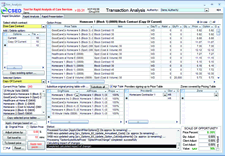
CSED offered 2 days of installation support to any council wishing to make use of TRACS. Within this time, once the logic had been built for a particular system, it was possible to provide the type of analysis illustrated based on current council data (see user documentation).
TRIPS generalised this approach
TRIPS built on this approach by replacing many hundreds of bespoke queries with generic tools to perform the extraction and processing. This made TRIPS suitable for any service - not just adult social care. Output presentation was also seriously limited. TRIPS provided the ability to store any format of chart (available within the Microsoft charting library) and use the charts to display any information (on a repeatable basis).
A tool designed to simulate changes in service
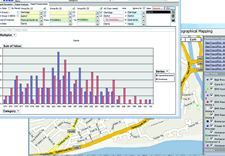
Graphical outputs and the ability to see services on a map
Any of the data collected by TRIPS could be plotted and simulations compared with the "as-is" (but only on column charts!). Google mapping was used to plot where service users lived relative to the supply base (helping to identify travel costs).
TRACS was packaged and distributed on DVD
TRACS was installed in over 50 councils. A comprehensive manual was written (double click on any of the pictures) and the product marketed at the various CSED national events (see publications).


